National Hispanic Heritage Month, which begins each year on Sept. 15, celebrates U.S. Latinos, their culture and their history. Started in 1968 by Congress as Hispanic Heritage Week, it was expanded to a month in 1988. The celebration begins in the middle rather than the start of September because it coincides with national independence days in several Latin American countries: Guatemala, Honduras, El Salvador, Nicaragua and Costa Rica celebrate theirs on Sept. 15, followed by Mexico on Sept. 16, Chile on Sept. 18 and Belize on Sept 21.
Here are some key facts about the nation’s Latino population by geography, and by characteristics like language use and origin group.
As part of our ongoing research of Hispanics in the United States, we analyzed how this group has changed over time using several data sources from the U.S. Census Bureau. The decennial census (PL94-171 census data) provided historical state and national population counts, and population estimates provided the latest data on total population, births and immigration. We also examined characteristics of the U.S. Hispanic population using the American Community Survey (ACS), which provides data on Hispanic origin, language use, country of birth and educational attainment. ACS data through 2019 was primarily accessed through Integrated Public Use Microdata Series (IPUMS) from the University of Minnesota; 2021 ACS data is from tabulations released by U.S. Census Bureau. The U.S. Hispanic population refers to those living in the 50 states and District of Columbia.
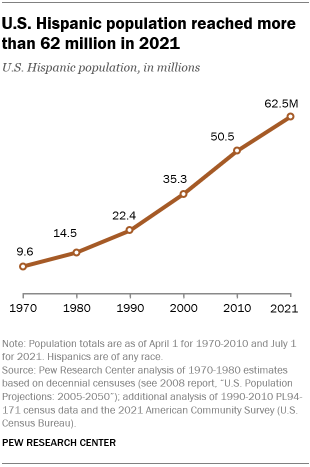
The U.S. Hispanic population reached 62.5 million in 2021, up from 50.5 million in 2010. The 19% increase in the Hispanic population was faster than the nation’s 7% growth rate, but slower than the 23% increase in the Asian population. In 2021, Hispanics made up nearly one-in-five people in the U.S. (19%) – the 50 states and the District of Columbia. This is up from 16% in 2010 and just 5% in 1970.
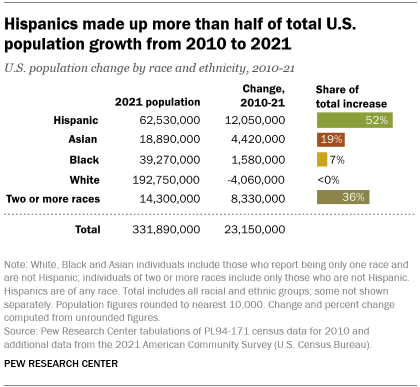
Hispanics have played a major role in driving U.S. population growth over the past decade. The U.S. population grew by 23.1 million from 2010 to 2021, and Hispanics accounted for 52% of this increase – a greater share than any other racial or ethnic group. The number of non-Hispanic people who identify with two or more races increased by 8.3 million during this time, accounting for 36% of the overall U.S. population increase.
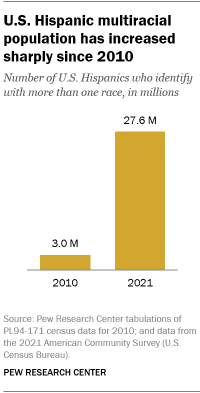
The number of Latinos who say they are multiracial has increased dramatically. Almost 28 million Latinos identified with more than one race in 2021, up from just 3 million in 2010. The increase could be due to a number of factors, including changes to the census form that make it easier for people to identify with multiple races and growing racial diversity that results in more Latinos identifying as multiracial.
Growth in multiracial Latinos comes primarily from those who identify as a specific race and “some other race” (i.e., those who write in a response to the race question) – a population that grew from 2.1 million to 25.0 million since 2010. Those who identify as a specific race and “some other race” now represent about 90% of multiracial Latinos. The increase was due almost entirely to growth in the number of those who identified as White and some other race, according to the 2020 census. At the same time, the number of Latinos who identified as White and no other race declined from 26.7 million in 2010 to 10.2 million in 2021.
People of Mexican origin accounted for nearly 60% (or about 37.2 million people) of the nation’s overall Hispanic population as of 2021. Those of Puerto Rican origin are the next largest group, at 5.8 million (another roughly 3.1 million Puerto Ricans live on the island as of 2021). Their numbers have been growing partly due to people leaving Puerto Rico and moving to the 50 states and the District of Columbia. Six other Hispanic origin groups in the U.S. have 1 million or more people each: Salvadorans, Cubans, Dominicans, Guatemalans, Colombians and Hondurans. In addition, by 2021, Spaniards accounted for just about 1 million U.S. Latinos.
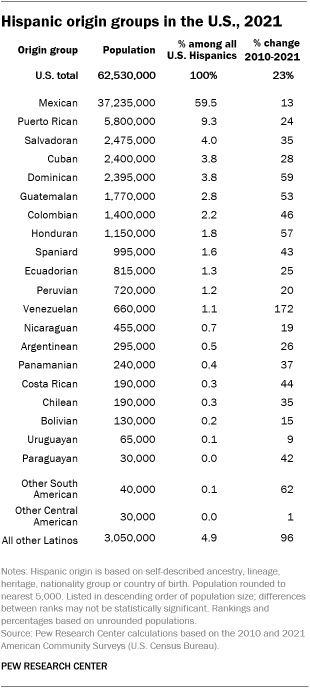
The fastest population growth among U.S. Latinos has come among those with origins in Venezuela, the Dominican Republic, Honduras and Guatemala. From 2010 to 2021, the Venezuelan-origin population in the U.S. increased 172% to 660,000, by far the fastest growth rate. Three other groups saw growth rates exceeding 50% between 2010 and 2021: Dominicans increased by 59%, followed by Hondurans (57%) and Guatemalans (53%).
By contrast, the number of people of Mexican origin grew only 13% from 2010 to 2021, by far the smallest rate of increase among the top origin groups. At 15%, the Bolivian origin population saw the slowest growth rate among other groups with at least 100,000 Latinos in 2021.
Hispanics have become the largest racial or ethnic group in California and Texas. This demographic milestone in California happened in 2014, and is a first for the state with the nation’s largest Hispanic population. In 2021, there were about 15.8 million Hispanics in California, up from 14.0 million in 2010. The non-Hispanic White population, the next largest group in California, declined from 15.0 million to 13.4 million during this time, reflecting a broader national trend. Latinos accounted for 40% of California’s population in 2021, among the greatest shares in the country.
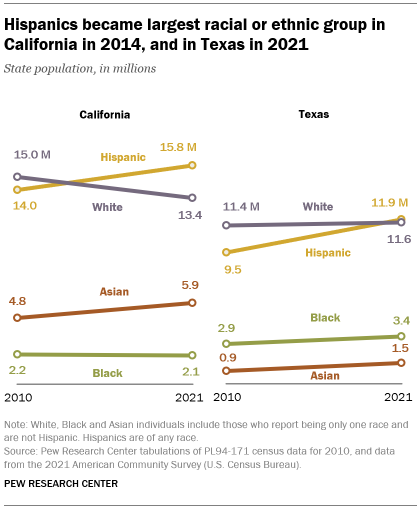
In Texas, the state with the next largest Latino population (11.9 million), Latinos also made up 40% of the state’s population and inched past the White population by about 230,000 to become Texas’ largest racial or ethnic group, according to the 2021 American Community Survey. (In New Mexico, Latinos are not only the largest group, they make up 50% of the state’s population in 2021 – the nation’s largest share.) In Florida, the state with the third-largest Latino population (5.8 million), Latinos made up 27% of residents.
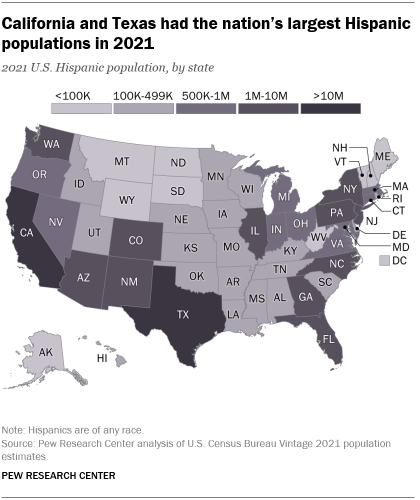
Rounding out the top five states with the largest Hispanic populations were New York (3.9 million) and Arizona (2.4 million). Eight more states – making 13 overall – had 1 million or more Hispanics: Illinois, New Jersey, Colorado, Georgia, Pennsylvania, North Carolina, New Mexico and Washington.
Vermont had the nation’s smallest Latino population (14,000) in 2021, followed by Maine (27,000), West Virginia and North Dakota (34,000 each), and South Dakota (41,000).
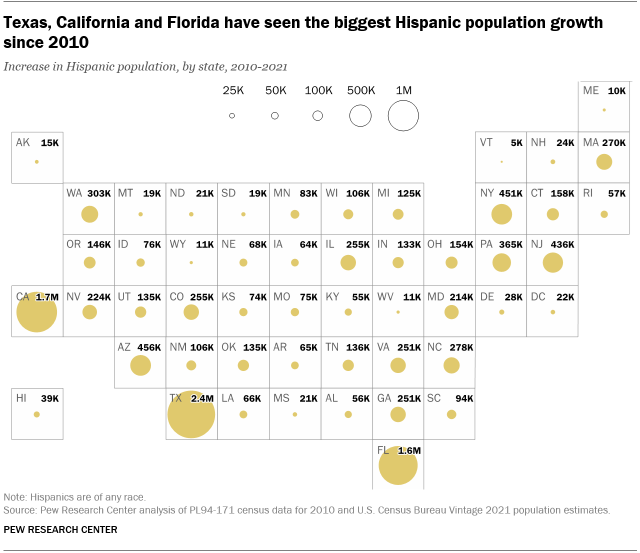
Three states saw their Hispanic populations increase by more than 1 million from 2010 to 2021. Texas (2.4 million increase), California (1.7 million) and Florida (1.6 million) together accounted for half of the nation’s Hispanic population growth over the past decade. Arizona (456,000 increase) and New York (451,000) had the next-biggest increases. All 50 states and the District of Columbia have seen growth in their Hispanic populations since 2010.
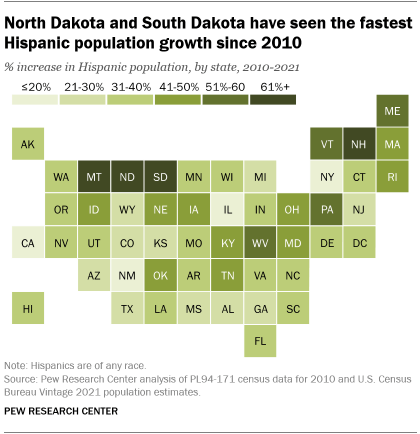
North and South Dakota have seen the fastest rates of growth in their Hispanic populations since 2010. The number of Hispanics in North Dakota more than doubled (155% increase) from 2010 to 2021, while in South Dakota it rose 87%. Even with the high growth rates, each of these states had fewer than 42,000 Hispanics in 2021, among the smallest populations in the country. The slowest growth happened in New Mexico (11% increase) and California (12%), states with significant Hispanic populations.
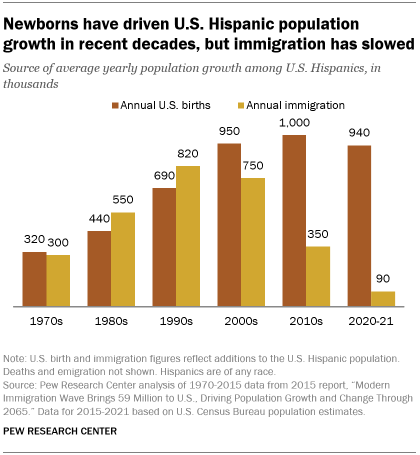
Newborns, rather than immigrants, have driven the recent growth of the U.S. Hispanic population. During the 2010s, an average of 1 million Hispanic babies were born each year, slightly more than during the 2000s. At the same time, about 350,000 Hispanic immigrants arrived annually, down substantially since the previous two decades. The predominance of new births over immigration as a source of Hispanic population growth in the 21st century is a reversal of historical trends. In the 1980s and 1990s, immigration drove Hispanic population growth as more Hispanic immigrants arrived than Hispanic babies were born.
In 2020 and 2021, virtually all Hispanic population growth has come from births, but immigration is expected to increase with the removal of pandemic-related restrictions.
The share of Latinos in the U.S. who speak English proficiently is growing. In 2021, 72% of Latinos ages 5 and older spoke English proficiently, up from 59% in 2000. U.S.-born Latinos are driving this growth, as their share on this measure has grown from 81% to 91% during the same timespan. By comparison, 37% of Latino immigrants spoke English proficiently in 2021, a percentage that has increased only somewhat since 2000. All told, 41.7 million Latinos in the U.S. spoke English proficiently in 2021.
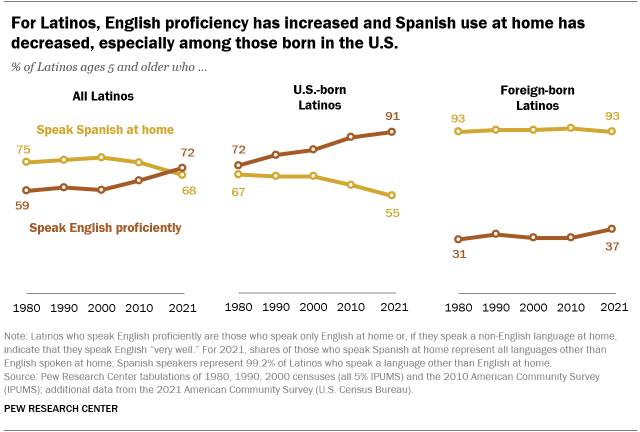
At the same time, the share of Latinos who speak Spanish at home declined from 78% in 2000 to 68% in 2021. Among the U.S. born, this share has decreased from 66% to 55%. Nearly all Latino immigrants (93% in 2021) say they speak Spanish at home. Even though the share of Latinos who speak Spanish at home has declined, the number who do so has grown from 24.6 million in 2000 to 39.3 million in 2021.
The share of U.S. Hispanics with college experience has increased since 2010. About 44% of U.S. Hispanic adults ages 25 and older had at least some college experience in 2021, up from 36% in 2010. Overall, the share of Hispanics with a bachelor’s degree or more education increased during this period, from 13% to 20%. The share with a bachelor’s degree or higher increased more among Hispanic women (from 14% in 2010 to 22% in 2021) than Hispanic men (12% to 18%).
The number of Latinos enrolled in college also increased between 2010 and 2021, from 2.9 million to 4.1 million. Among all U.S. college students, the share of Latinos increased from 14% in 2010 to 19% in 2021.
Four in-five Latinos are U.S. citizens. As of 2021, 81% of Latinos living in the country are U.S. citizens, up from 74% in 2010. This includes people born in the U.S. and its territories (including Puerto Rico), people born abroad to American parents, and immigrants who have become naturalized citizens. Virtually all Puerto Ricans living in the country are U.S. citizens. Spaniards (93%), Panamanians (88%) and Mexicans (81%) have some of the highest citizenship rates as of 2019, while Hondurans (51%) and Venezuelans (48%) have the lowest rates. (Data on citizenship rates among specific Hispanic origin groups is as of 2019; 2021 data not yet available.)
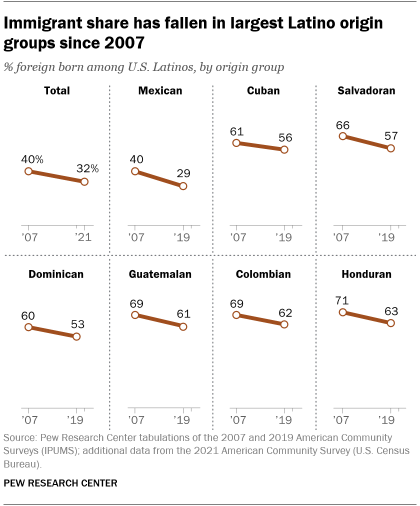
The share of U.S. Latinos who are immigrants is on the decline and varies by origin group. From 2007 to 2021, the number of Latino immigrants increased modestly, from 18.0 million to 19.9 million. But immigrants made up a declining share of the Latino population – decreasing from 40% to 32% during this span as the number of U.S.-born Latinos increased and the arrival of new immigrants slowed.
Fewer than a third of Mexican-origin Latinos (29%) are foreign born as of 2019. That’s far lower than the shares among the other major groups by population – Hondurans (63%), Colombians (62%), Guatemalans (61%), Salvadorans (57%), Cubans (56%) and Dominicans (53%). Each of these groups saw the immigrant share of their populations decline from 2007 to 2019. By contrast, 77% of Venezuelans are foreign born, the highest of any origin group; this share is up from 73% in 2007. People born in Puerto Rico are U.S. citizens at birth. (Data on nativity for specific Hispanic origin groups in 2021 is not currently available.)
Note: This post has been regularly updated since it was originally published on Sept. 16, 2014.